

It hasn’t been a great year for alternative investments. To put it simply, vanilla trumped spice. Only one alternative class—real estate—beat the S&P 500 Index in 2014. Of course, alternatives, or “alts,” aren’t meant to replace core holdings, only to augment them.
And unless you’re adding new money to your portfolio, you can’t just drop in a slug of alts. You typically make room for such investments by reducing other allocations. Yes, a dollop of real estate might have boosted your returns over the past year, but at what cost?
Let’s put this in real-world terms. The one-year return of the PowerShares Active US Real Estate ETF (NYSE Arca: PSR) is nearly three times that of the SPDR S&P 500 ETF (NYSE Arca: SPY). Better still, PSR earned its outsized gain with less volatility than the blue chip portfolio. Did that make real estate your best alternative bet last year? Well, maybe. It really depends on your definition of “best.”
To see what I mean, let’s look at an array of liquid alts—exchange-traded funds pursuing hedge fund or non-traditional strategies. In addition to the PSR portfolio, the other tactics are exemplified by:

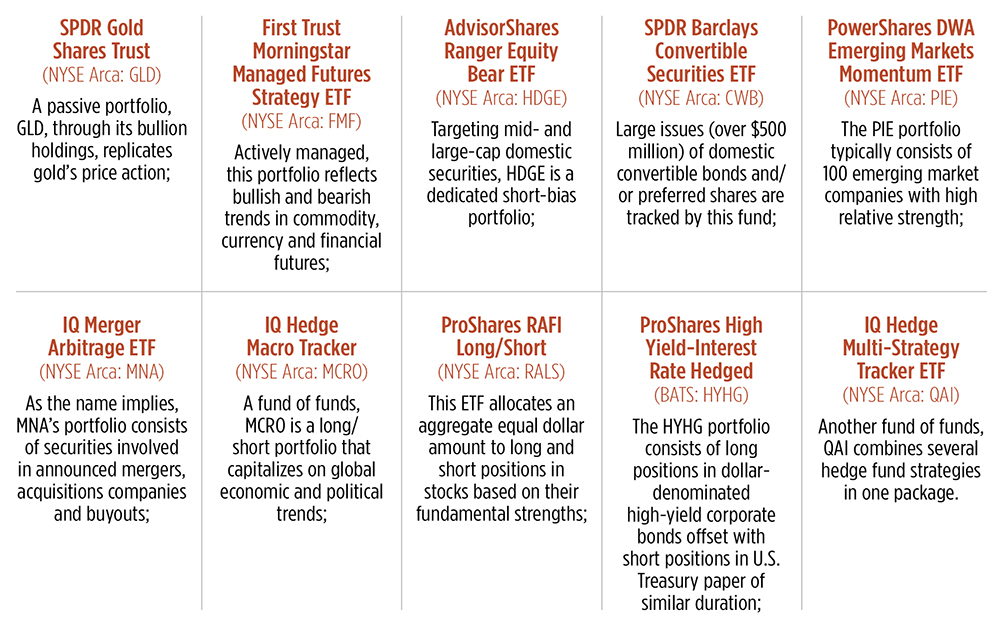
Let’s now gauge these alt funds against two core holdings: the SPY fund mentioned above and the iShares Core US Aggregate Bond (NYSE Arca: AGG), a compendium of debt securities that includes U.S. Treasury and agency notes, corporate bonds, and mortgage-backed and other asset-backed paper.
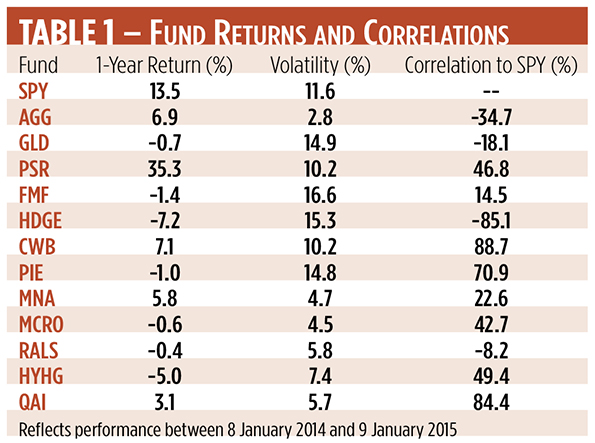
Four funds in Table 1 stand out for their negative correlations to SPY. One, AGG, is a core holding. Seemingly only three of our alt funds provided the much-vaunted “hedge” against domestic cap-weighted equities. One is a perennial—GLD, representing gold bullion. The other two are equity funds. RALS earns its mildly negative coefficient because of its long/short admixture of stock exposures. The most significantly uncorrelated asset was the short-only HDGE portfolio.
The Sharpe Ratio
Going a step further, we can analyze the universe in terms of risk. One conventional measure is the Sharpe ratio—the quotient of a fund’s excess return over its volatility. A more positive ratio denotes a better risk-adjusted return. Last year, the hefty return of the PSR fund raised its Sharpe ratio to the top of the heap.
The notion of risk embodied in the Sharpe ratio, however, is vexing. Measuring volatility as the standard deviation of returns deems all price excursions from the mean—negative and positive—to be risky. Intuitively, though, you’d likely welcome upside volatility if you held a long position.

Another metric, the Sortino ratio, gauges an investment’s risk solely on the basis of its downside deviance. Like the Sharpe ratio, a higher Sortino value denotes a “better” gamble.
Table 2 points out the decided advantage enjoyed by bond investors last year. The AGG fund’s combination of modest downside volatility and positive return shot its Sortino ratio to an atmospheric height. Among the alternatives, PSR’s Sortino ratio comes out on top.
So it seems like a slam dunk. Real estate would have done you proud last year. But there’s one more test. How would the addition of PSR have actually impacted a core portfolio? Would PSR have been the best adjunct to stock and bond exposures?
To find out, we start with the classic “60/40” portfolio: 60 percent domestic equities, represented by SPY, and 40 percent broad-based bonds, proxied by AGG. That’s our control portfolio. We’ll test the utility of our hedge funds with a 10 percent carve-out from the equity side. That’ll make our experimental portfolios 50 percent SPY, 40 percent AGG and 10 percent alternative investment fund.
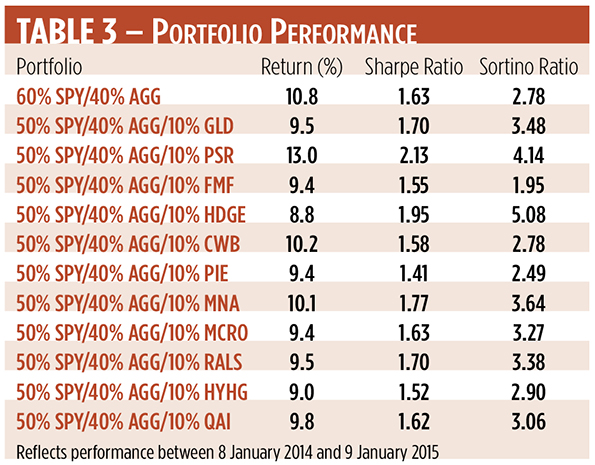
When added to a core portfolio, PSR did, indeed, enhance returns. Not only that, a portfolio augmented with real estate cranked out better Sharpe and Sortino ratios than those of a vanilla mix.
But from a hedge standpoint, you could argue that HDGE, the dedicated short-bias portfolio, actually played its role best. Take a look at the Sortino ratio of the HDGE-enhanced portfolio. At 5.08, it’s well above that of the PSR mix, even though the portfolio return was fully two percentage points below that of the core holdings. Given HDGE’s strongly negative correlation to SPY, there’s no surprise in that.
Investors with perpetual investment horizons, such as endowments and foundations, are more likely to focus on Sortino ratios as metrics of success. After all, their money must last forever; drawdowns are anathema. Still, portfolio runners do need to justify their efforts with better-than-market returns over the long run.
We’ve only looked at short-term performance here. As some of the younger funds become seasoned, it’ll be worth a revisit to see how they fare over future market cycles.