

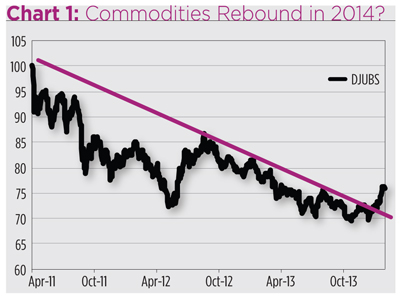
In January, while the S&P 500 Composite (SPX) slid 3.6 percent, the Dow Jones UBS Commodity Index (DJUBS) gained 0.3 percent. DJUBS is a long-only benchmark made up of 20 non-financial futures. It wasn’t much of a gain and one month doesn’t spell “turnaround,” but this isn’t just a one-month deal. Commodities, on the outs since 2011, have actually broken above a multi-year downtrend line. (See Chart 1.)
There are, in fact, a number of technical signals suggesting the commodity sector has put in a major cycle low. Several futures markets are in near-term price uptrends, a confluence of bullish scenarios not seen in years. As long as prices trendupward, the path of least resistance seems to be sideways to higher.
All this is certainly good news to holders of long-only commodity index products. There are a fair number—16, in fact—of these domestic exchange traded funds and notes representing $10.4 billion in market capitalization.
But index trackers aren’t the only products populating the commodity sector. Active products—emulators of managed futures hedge funds—are making inroads. The question advisors and investors seeking commodity exposure now face is, “Active or passive?”
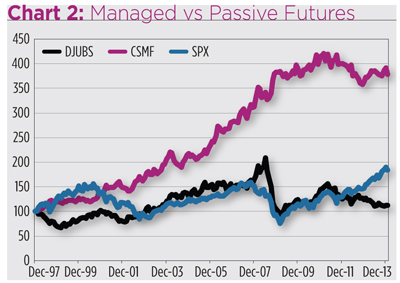
If history is any guide, the answer ought to be “active.” Managed futures have outperformed long-only commodity investments over the past two decades, as evidenced by the track record of the Credit Suisse Managed Futures Liquid Index (CSMF).
CSMF mimics the trades a typical momentum-following hedge fund would make, i.e., buying when the short-term moving averages for various commodity futures exceed their long-term averages and selling when long-term averages exceed short term. Since 1997, CSMF has outdone DJUBS by a threefold margin, earning a Sharpe ratio of 1.04 versus the -.36 ratio booked by the long-only benchmark. Simply put, the rewards earned by an actively managed futures strategy have more than compensated abiding investors for the risks undertaken.
CSMF, unlike DJUBS, is negatively correlated to the S&P 500, making managed futures a better portfolio diversifier than long-only commodity exposure. The hedge value of an active futures strategy was clearly demonstrated when SPX toppled 29 percent in the second half of 2008; DJUBS nosedived 43 percent while CSMF rose 17 percent. (See Chart 2.)
 The reason for the performance disparity is simple: The long-only approach leaves alpha on the table. Since any futures trade—short or long—is margined, bearish positions can be undertaken with the same ease (and risk) as bullish bets. A lot of commodity price volatility is, in fact, downward variance and represents a rich trove of potential profits for short-enabled strategies. While down days account for roughly half of all futures trading sessions, the average daily losses for many key contracts—such as coffee, corn, cotton, cattle, hogs, natural gas and wheat—are greater than average daily gains. These commodities offered exceptional short-selling opportunities over the past two decades. All, in fact, are currently trading at prices lower than their December 1997 levels.
Managed Futures ETFs
There are three players in the managed futures ETF derby. The eldest launched in January 2011 and the youngster debuted in October 2013. In a side-by-side comparison, youth seems volatile, but productive.
The segment’s granddaddy is the WisdomTree Managed Futures Strategy Fund (NYSE Arca: WDTI) which is managed to emulate, but not directly track, the returns of the Diversified Trend Index, a long/short strategy that juggles two dozen currency, commodity and Treasury futures.
Since October, granddad has doddered a bit. WDTI’s weak performance came about because the strategy missed out on uptrends in agricultural commodities such as wheat and soybeans. In fact, WDTI was most recently short beans. The fund was also short natural gas heading into a very cold winter.
Still, WDTI has a lot going for it. Number one, its size. With $142 million under management, the fund’s closure risk is low. Number two is its liquidity. Bid/ask spreads are relatively tight for an ETF of this type, and volume’s solid at 26,000 shares ($1.1 million) a day. Lately, WDTI’s traded at a 3 basis point premium over NAV.
Because there’s no stock exposure in the WDTI stratagem, the WisdomTree portfolio shows the least correlation to equities. While that’s not been a return-enhancer over the past quarter, it makes the old man a good risk diversifier.
The fund also exhibits a low correlation to fixed income, owing to its net zero exposure to Treasurys. (At last look, WDTI was long 10-year notes and short an equal slug of 30-year bonds, essentially putting the fund in the yield curve, steepening business.)
Of the three ETFs, WDTI acts most like a managed futures hedge fund, reflected in its r2 (r-squared) and beta coefficients against CSMF. (See Table 2.)
There’s been a more tenuous correlation to managed futures exhibited by the $5 million First Trust Morningstar Managed Futures Strategy Fund (NYSE Arca: FMF). Launched in July 2013, FMF uses commodity, currency and equity futures in roughly equal proportions. Similar to WDTI, FMF attempts to model, not mimic, its benchmark (in this case, the Morningstar Diversified Futures Index, or DFI), reserving for its portfolio runners the right to manage contract selection and rolls in the pursuit of excess returns.
Recently FMF has been biased towards equity, devoting more than a quarter of its heft to long positions in S&P 500 and German DAX futures. There’s not a drop of fixed income exposure in the portfolio, however. Unlike WDTI’s net long tilt in commodities, FMF had a slightly bearish bias over the past quarter, highlighted by short positions in precious metals and corn. Net currency exposure, like WDTI’s, has been long.
Bid/ask spreads are about four times the width of WDTI’s market and daily volume averages just 4,400 shares ($224,000). That average, however, should not be expected on any given day. Since October, nearly 60 percent of FMF’s trading sessions were actually zero-volume days.
Not surprisingly, the apparent spread between FMF’s market price and its portfolio value is pretty wide. Slack demand for the ETF is reflected in an average 16 basis points discount. There’s been considerable volatility in this spread, however, as values have ranged between a 112 basis points premium and a 127 basis points discount, four times the variance found in WDTI.
The sector’s newbie is the First Trust Global Tactical Commodity Strategy Fund (NYSE Arca: FTGC) which launched just three months after its FMF sibling debuted. FTGC’s asset growth has been on a more dramatic trajectory than FMF’s; the newer fund has more than $16 million under management now. Trading FTGC is easier than FMF as daily turnover averages 31,000 shares ($988,000) and zero-volume days make up just 15 percent of its track record.
FTGC’s bid/ask spread tends to be tighter than FMF’s, but the average variance between market prices and NAVs—at 18 basis points—tends to be just as wide, if not wider. The big difference is that FTGC trades at a premium, not a discount, symptomatic of greater demand. In its lifetime, FTGC has traded at an apparent premium as high as 104 basis points and a discount as deep as 105 basis points.
FTGC is now handily outdoing the other two actively managed futures ETFs, though not without a fair degree of volatility. While FTGC’s standard deviation is less than that of SPX, it’s still twice that of WDTI and FMF.
The outperformance is largely due to concentration. Its portfolio is comprised of just 14 positions—all commodities, no financials—half as many as WDTI or FMF. FTGC’s managers make big bets, too. The fund’s average position size is 98 contracts. For FMF, the typical wager is just two contracts and for the much larger WDTI, it’s 73 contracts. FTGC’s outsized positions are all the more remarkable when you consider that the newcomer is barely one-tenth the size of WDTI.
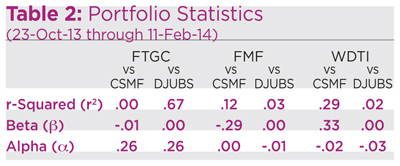
FTGC acts like a long-only fund. That’s because it is long-only, at least for now. Its r2 coefficient versus DJUBS is .67, a much tighter fit than exhibited by the other two portfolios. (See Table 2.) In contrast, FTGC’s coefficient against the short-enabled CSMF is nil.
Mostly, FTGC has benefited from a “winter” strategy, namely long positions in coffee, natural gas and soybean meal.
Short Track Records
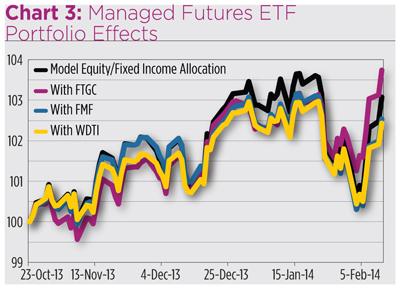
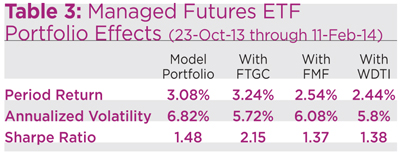
It’s early days for managed futures ETFs, so it’s dangerous to make too many generalizations regarding their behavior. Still, there are indications of their relative utility as portfolio adjuncts. Compare the recent performance of a model portfolio (60 percent equities, 40 percent fixed income) against constructions with a managed futures overlay (50 percent equities, 35 percent bonds and 15 percent managed futures).
As detailed in Table 3, adding FTGC both augmented returns and dampened volatility to yield a significantly higher Sharpe ratio. The question before investors and advisors now is whether there’s any permanence to this outperformance. Of the three extant ETFs, FTGC has the longest leash: It’s not tethered to a mechanical strategy like DTI or DFI. FTGC managers have recently opted to go “all long” and, by doing so, have extracted a big dollop of alpha. FMF and WDTI portfolio runners don’t have that latitude. Not yet, at least.
While the cold winter has driven some commodity prices skyward, weather has not been the sole reason for a widespread futures rebound. The expansive rally may be a warning sign of incipient inflation. If so, the long-only approach adopted by FTGC may have some legs.